Vision
A dashboard that makes computer vision output readable by people who are not engineers.
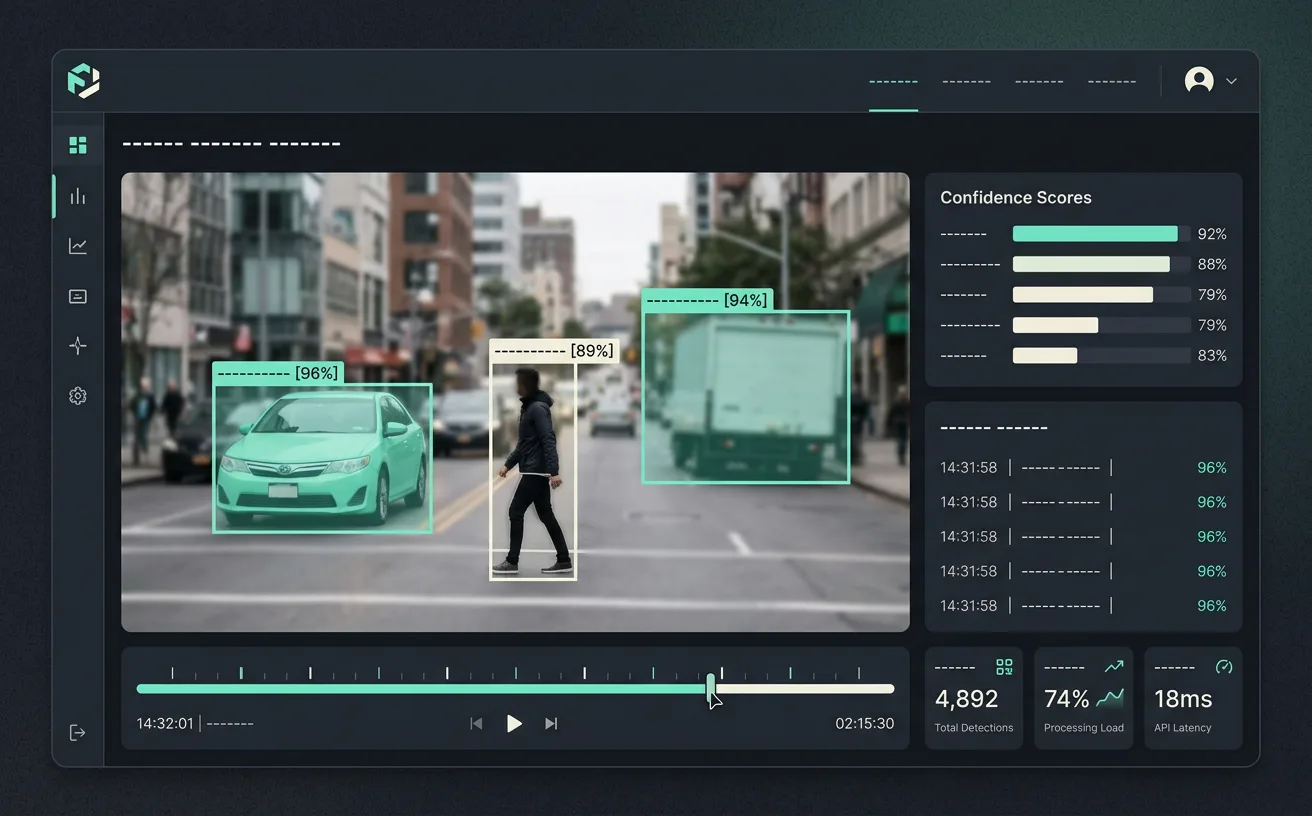
Introduction
Vision Labs ran detection models that worked well and were impossible to operate. Results scrolled past in a log file that only an ML engineer could read.
I built an interface where an operations team can watch detections live, adjust thresholds, review flagged moments and export evidence — without touching code.
Goals
- Surface live detection results in real time
- Let operators tune confidence without a deploy
- Make review and export a two-click job
- Keep latency low on continuous video
- Show model health over time
Target audience
- Operations teams monitoring sites daily
- ML engineers who need a control surface
- Managers who review weekly trends
Approach
The interface had to be honest about uncertainty, so every detection carries a confidence value the operator can see and move.
Latency was the budget: overlays render on the client while inference stays on the server, which keeps the video smooth without faking results.
Review mode turns the live feed into a searchable timeline, so a week of footage becomes a few minutes of reading.
Design
A live canvas with adjustable confidence thresholds
Timeline scrubber with flagged-event markers
Model health panel: drift, accuracy, uptime
Deliverables
- Dashboard design system
- Real-time front-end build
- Streaming API integration
- Review, tagging and export flows
- Monitoring and alerting setup
Stack
React, Python, FastAPI, WebGL, Redis, Docker