Nova
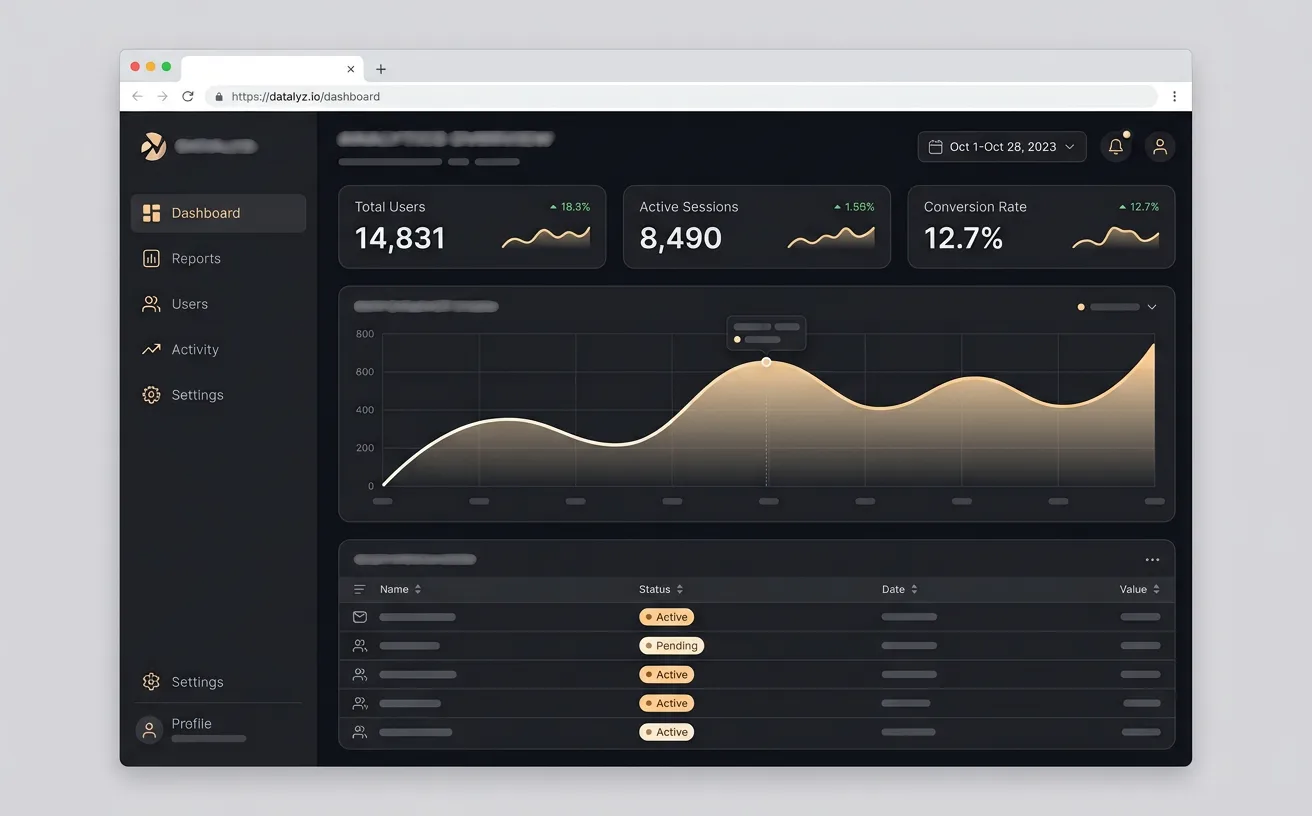
A dashboard that turns messy product data into decisions a small team can actually make.
Introduction
Nova's team was making product decisions from screenshots pasted into Slack. Numbers lived in five different tools, and nobody trusted the same source twice.
The goal was a single place where a founder, an ops lead and an engineer could all look at the same truth — and act on it in under a minute.
Goals
- Put every core metric in one place
- Let non-technical founders self-serve without a data team
- Stay usable on a 13-inch laptop screen
- Load a full dashboard in under a second
- Stay white-label ready for resale
Target audience
- Seed-stage founders (28–45)
- Operations leads who live in spreadsheets
- Engineers who need raw numbers, not summaries
Approach
I started with five customer interviews and mapped the three questions every user opened the dashboard to answer. Everything else moved one level down.
Density with breathing room was the core design tension: enough data for power users, clear enough for someone opening it for the first time.
On the build side I wrote the component library first, then the screens, so every chart, table and filter shared one visual language and one performance budget.
Design
Dark-first interface with a light mode for daytime screens
A saved-views system so each person opens to their own numbers
Charts built on a shared token set — no library defaults anywhere
Deliverables
- Design system and component library
- Responsive dashboard layouts (desktop, tablet, mobile)
- Front-end build in React + TypeScript
- Chart framework and reusable data hooks
- Documentation for the in-house team
Stack
React, TypeScript, Node.js, PostgreSQL, Recharts, Vercel